Business intelligence (BI) software transforms scattered data into unified insights for sharper planning. BI analyzes trends, metrics and monitoring alerts to inform decisions. It does this through interactive reports, dashboards and visualizations, rather than static spreadsheets. This visibility keeps companies nimble.
This guide reviews the top-rated BI platforms fueling more accurate 2024 decision making by consolidating analytics.
BI Tools Drive Intelligence Through Centralized Data
BI solutions gather previously scattered data sources into integrated “command centers.” This simplifies access to intelligence.
- Historical sales patterns paired with pipeline forecasts
- Production volumes, defect rates and real-time supply chain alerts
- Help desk ticket influx alongside customer satisfaction score trends
- Visitor website behavioral analysis predicting purchase tendencies
- Early security notices indicating malicious threats
Leadership leans on BI capabilities demonstrating operational and financial improvements justifying investments – converting guesswork into reliable growth acceleration.
So here are the 9 Best BI Software Products Enabling Informed 2024 Growth:
1. Microsoft Power BI
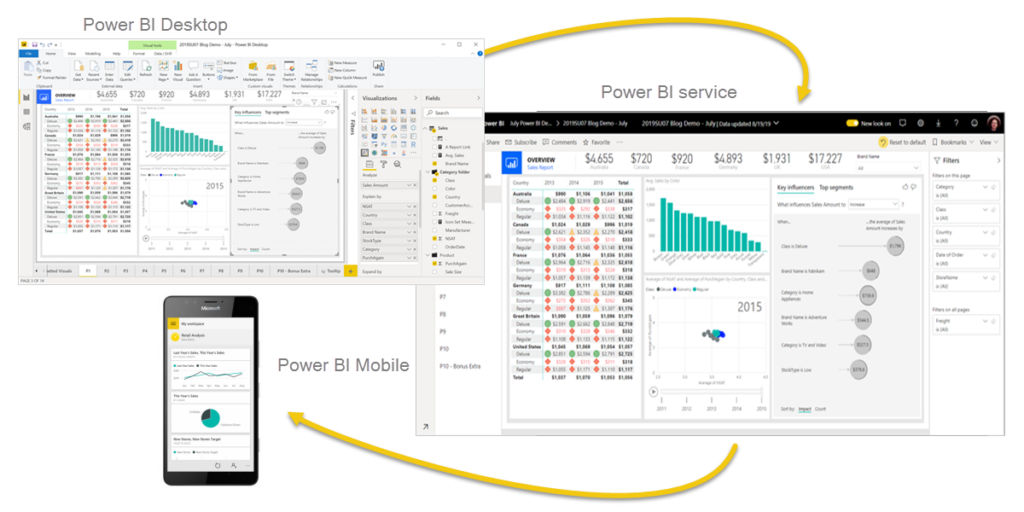
Source: https://learn.microsoft.com/en-us/power-bi/fundamentals/power-bi-overview
Familiar suite giant Microsoft Power BI makes consolidating data into interactive visualizations simple through prebuilt templates and straightforward modeling. Drag-drop reports appeal to personnel less technically versed. Tight integration with complementary Microsoft cloud services completes the package for many existing customers.
However, some still find Power BI limiting handling complex data relationships or custom visuals.
Key Capabilities:
- Insightful Dashboards – Enables no code drag and drop data visualization building for non-technical users
- Built-In AI – Automatically prepares data while detecting insights through machine learning
- Cloud Data Warehouse Integration – Unifies insights from Azure data sources into singular views
Ideal Users: Organizations without extensive analytical modeling needs who wish to enable general departments with basic metrics monitoring and planning functionality leveraging Microsoft ecosystem integration.
2. Tableau
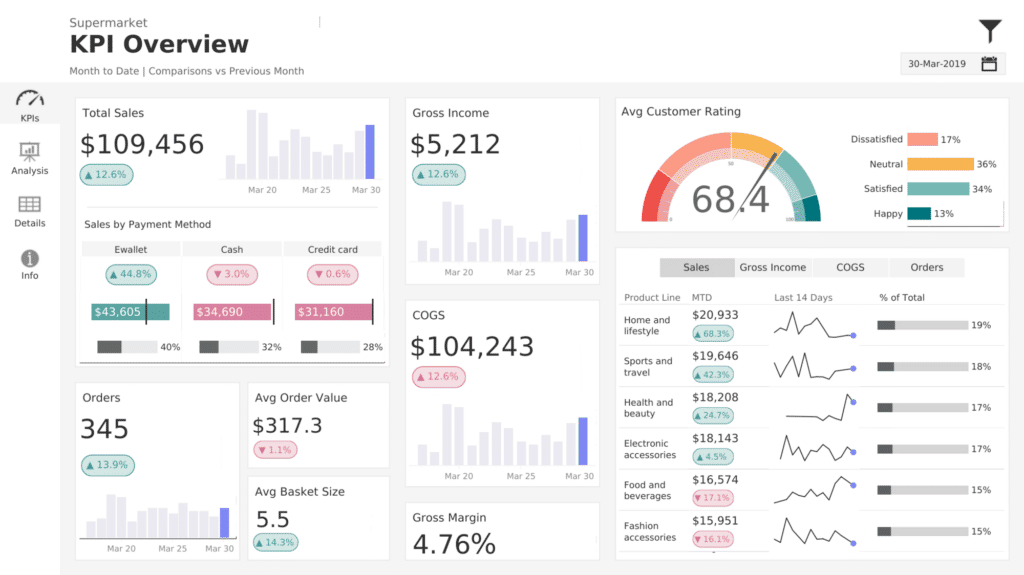
Source: https://www.tableau.com
Tableau carries industry leader reputation empowering versatile interactive data visualization catering to demanding analytics needs. The vendor offers a breadth of mapping, forecasting and statistical models suits wide use case variability. Tableau serves both technical data scientist personas along with friendlier self-service options.
Just expect high licensing costs at volume paired with required training grasping extensive platform depth.
Key Features:
- Interactive Data Visualization – Fast slicing dashboard flexibility allows rapid user-driven insight extraction from multiple perspectives
- Enterprise Scalability – Handles extremely high volume, velocity and variety of heterogeneous data inputs
- Mobile and Multi-Platform Optimization – Consumption including mobile, on-premise, cloud
Ideal Users: Larger organizations with expansive, complex analytics use cases demanding flexible delivery to diverse audiences.
3. Qlik Sense
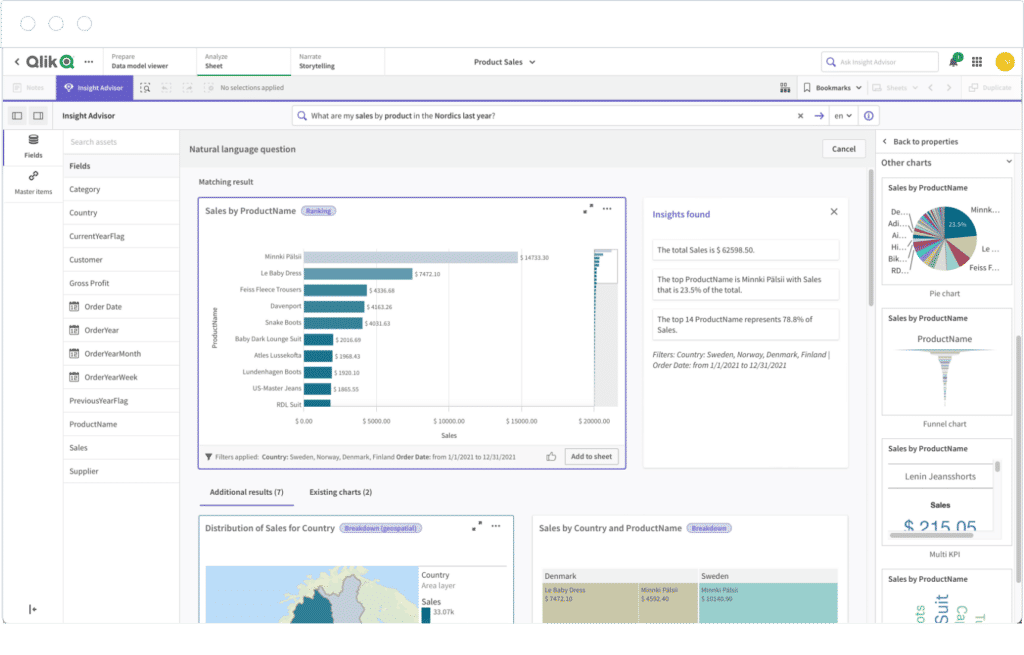
Source: https://www.qlik.com/us/products/qlik-sense
As analytics pioneer for associative data modeling, Qlik Sense enables users rapidly uncover and navigate unseen data linkages through intuitive guided analysis features. Strong active intelligence focus continually suggests additional key information relationships encouraging exploration.
Downsides over other options center only on a steeper learning curve mastering the platform’s more unique approach.
Why Qlik Stands Out:
- Associative Data Modeling – Excels allowing users to rapidly uncover hidden relationships between varied data points through machine learning
- Guided Analysis Features – Enables organic insights discovery through contextual suggestions for next steps based on behaviors
- Multi-Cloud and Platform Access- Flexible Windows, SaaS and Mobile availability
Ideal Users: Innovative mid-market firms desiring cutting-edge guided analytics matching cloud-first strategies.
4. Sisense

Source: https://www.sisense.com/dashboard-examples/
Where more technical groups want added design control over custom models, dashboards, integrations and other elements beyond prebuilt templates, Sisense earns praise empowering precise bespoke analytics needs without oversimplifying. Developer-friendly tools allow tailoring robust systems. Just expect required investments training power administrators.
Where Sisense Wins Users:
- Extreme Customizable Dashboards/Reports – Tailors visualizations and reporting matching unique needs
- Developer Capabilities – API access offers extensive custom modeling that avoids constraints of typical platforms
- Hybrid Deployment Options – Right sizes across cloud, on-premise and software infrastructure
Ideal Users: Technically demanding and growing mid to large companies wanting granular customization.
5. Zoho Analytics
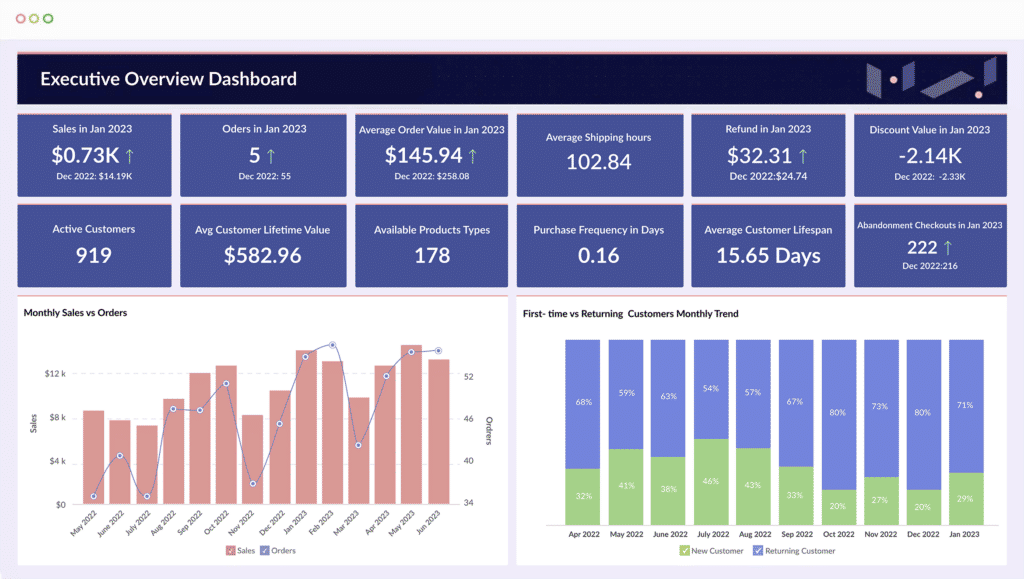
Source: https://www.zoho.com/analytics/
Zoho Analytics balances affordability with core trend analysis features for SMBs needing consolidated data visibility without costly overkill. Usability focuses on critical features actually utilized. Integrations handle typical small business platforms.
Unless analytics feature breadth tops priority lists, Zoho cost-conscious capability suits many budget-limited analysis upgrade initiatives well.
Key Capabilities:
- Cost Effective Pricing – Competitively low per user license costs packed with core insight functionality
- CRM Optimization – Purpose built dashboard analysis unifying sales and marketing data
- Ease of Adoption Company Wide – Intuitive workflow needs little extended personnel expertise
Ideal Users: Budget conscious SMBs and departments seeking foundational unified reporting without overpaying for unused advanced functionality.
6. Oracle Analytics Cloud
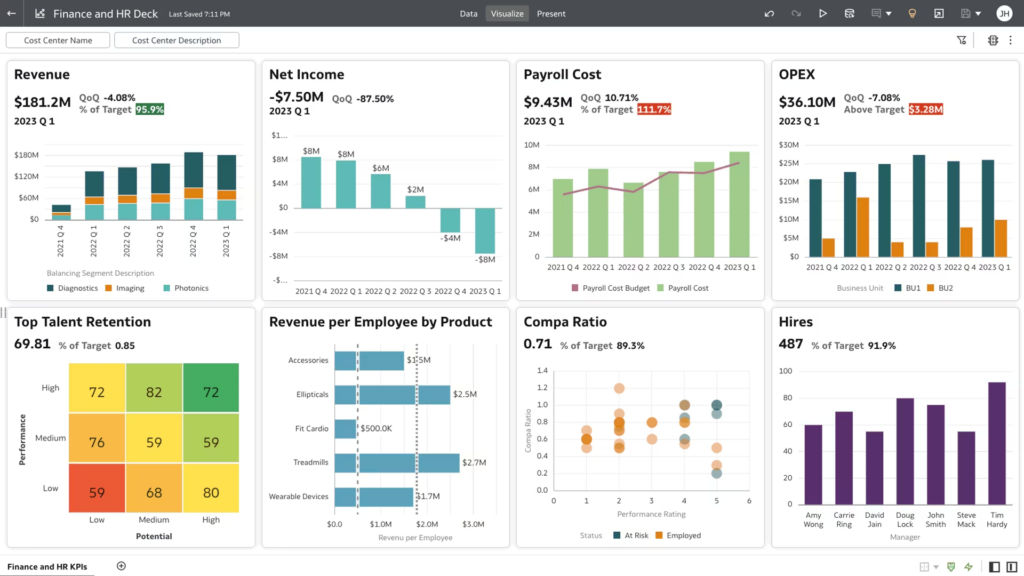
Source: https://www.oracle.com/in/business-analytics/
For organizations running Oracle business solutions, OAC merit strong consideration bundling essential analytics with fewer third party visualizations to learn separately. Tight on-premise database and ERP ecosystem integration eases consolidating transactional records.
Just note, functionality prove somewhat less refined than dedicated analytics-first competitors. But streamlined Oracle stack alignment brings convenience.
Key Oracle Analytics Cloud Features:
- Native Oracle Ecosystem Integration – Automates consolidating database, ERP and other application data silos into synergized intelligence surfacing key trends and signals
- Augmented Data Analysis – Machine learning enrichment adds narrated text explanations and statistical forecasting to reporting
- Enterprise Scalability – Processes high volume and throughput needs even for largest operational analytics environments without slowdown
Ideal Users: Existing embedded Oracle product customers wanting improved utilization of current infrastructure as launching point to expanded use cases long term, not requiring extensive third party connections initially.
7. SAS Visual Analytics

Source: https://www.sas.com/en_in/software/visual-analytics.html
Trusted analytics brand SAS Visual Analytics shines where statistical analysis and data science preprocessing requires fine tuning control beyond casual self service. SAS also built reputation ensuring rigorous data governance compliance in highly regulated sectors like Financial and Healthcare.
Expect to trade ease of use for advanced modeling depth compared to alternatives however. This tool targets experts.
Where SAS Stands Out:
- Top Class Statistical Rigor – In depth programming and modeling enables advanced analytics use cases leveraging some R/Python integration opportunities
- Industry Specific Accelerators – Purpose built starter data models exist for financial services, insurance and additional vertical needs
Ideal Users: Heavily regulated, technically mature organizations desiring precise analytics aligned to mandatory reporting needs and employing data teams that can leverage programming capabilities.
8. Domo BI

Source: https://www.domo.com/business-intelligence#reporting
Specializing around executive metrics, Domo BI delivers quick consolidated KPIs and reporting through spreadsheet-like interfaces many end business leadership already understand while lowering analyst prep demands. API extensibility allows customized connections capturing niche operational signals beyond the platform norm.
Ready access to hundreds of prebuilt integrations allows inclusion of relevant operational signals beyond the platform norm. Collaboration features empower rapid storage, annotation and discussion across leadership.
Where Domo Wins Users:
- Leadership Metrics Focus – Strategic dashboards spotlightting sales, marketing and key financial indicators
- Analysis Acceleration Tools – Integrated collaboration and workflow efficiencies speed dissemination
- Developer Extensibility – Custom connections and solution embedding enabled via extensive API capabilities
Ideal Users: Executives and business/operations leadership wanting accelerated unified visibility into integrated KPIs.
9. SAP Analytics Cloud
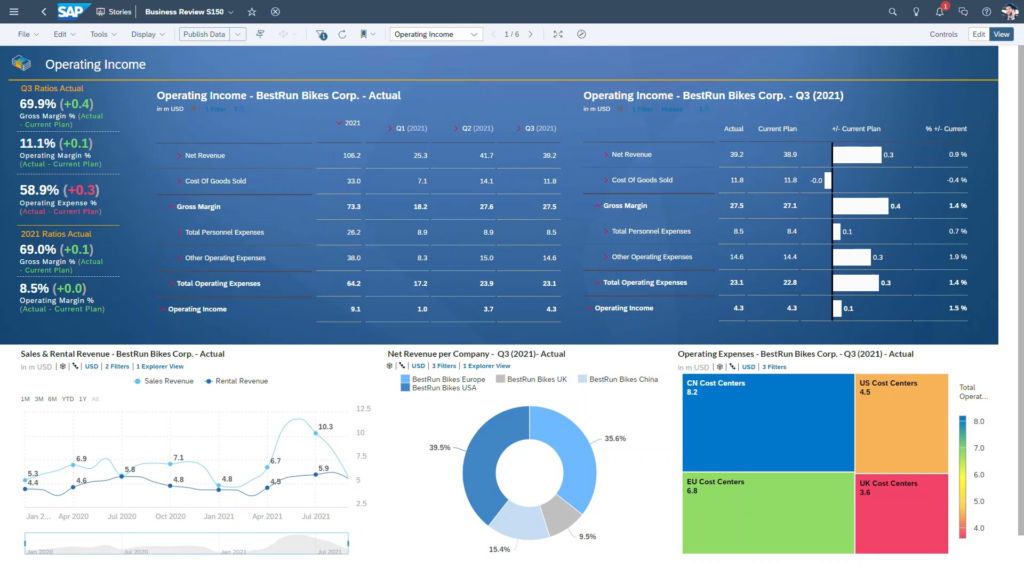
Source: https://www.sap.com/india/products/technology-platform/cloud-analytics.html
There is strong loyalty among the global SAP customer base. They want to standardize business processes company-wide. They find SAP Analytics Cloud appealing because it simplifies access to enhanced intelligence across related systems. It does this through automation. It does this without migrating data warehouses. In addition to connector advantages, SAP Analytics Cloud focuses on easing report building and predictive modeling versatility. It suits a wide range of people, not just expert analytics resources. It does this through ML assisted data preparation, pattern recognition, and planning capabilities. This helps SAP Analytics Cloud lead over competitors.
Key Features:
- SAP Centric Unification – Streamlines ingestion and contextualization across SAP S/4HANA, SuccessFactors, CRM and other core signals
- Predictive Analytics – Incorporates machine learning enrichment for statistical forecasting and planning assistants
- Simplified Administration and Content Creation – Drag and drop tools lowering barriers speed dashboarding and reporting
Ideal Users: Existing global SAP customers running business process backbone systems seeking intelligence acceleration and added productivity without migrating existing data environments.
Key Evaluation Criteria for Top 2024 BI Tools
With BI fueling organizational progress, matching robust platforms to specific analytics process needs proves crucial.
Priorities to examine when researching providers include:
- Integrations – What critical databases, apps and files readily connect for consolidation?
- Flexibility – Can users customize dashboards fitting their perspective into workflows?
- Sharing – How easily distributed are reports, metrics and data regionally or company-wide?
- Mobile Access – Are insights consumable from anywhere or just desktop?
- Skill Level Needs – What training oranalitcs backgrounds should stakeholders have?
Carefully weighing key elements drives project ROI by picking aligned solutions.
Conclusion
The above business intelligence overview details leading platforms. They enable performance lift through data unification. But simply buying dashboards alone fails driving sustained results. Phased roadmaps, change enablement and capability building strategies allow genuinely achieving operational intelligence – where once siloed data accelerates decision making continually through informed planning.
FAQs
Common signals include disconnected reporting processes, business teams lack accessible insights for daily decisions, metrics not tying to strategic KPIs, growing data volumes slow manual analysis.
User friendly solutions like Microsoft Power BI offer templates lowering introductory learning. But dedicated analyst coaching will maximize advanced functionality. Expect 2-3 months ramping complex platforms like Tableau, and longer for coding-based options.
Tie software capabilities to department metrics like sales pipeline visibility lifting conversion rates, help desk consolidation improving customer satisfaction, supply chain integration smoothing operations through lower defects and inventory variability.
Mileage varies greatly depending on scope from 6 weeks for isolated use cases to 9-12 months integrating rich datasets across global divisions. But phased rollout by units is common balancing speed and control.
Look for platform adherence to latest data protection and transport encryption standards, granular access controls and permission auditing, SAML/OAuth external authentication support with logging, and SOC2 assurances from hosting providers verifying diligent operations.
